The pie chart presents the percentage contribution of different macronutrients to a typical 2,000 kcal diet of a person.
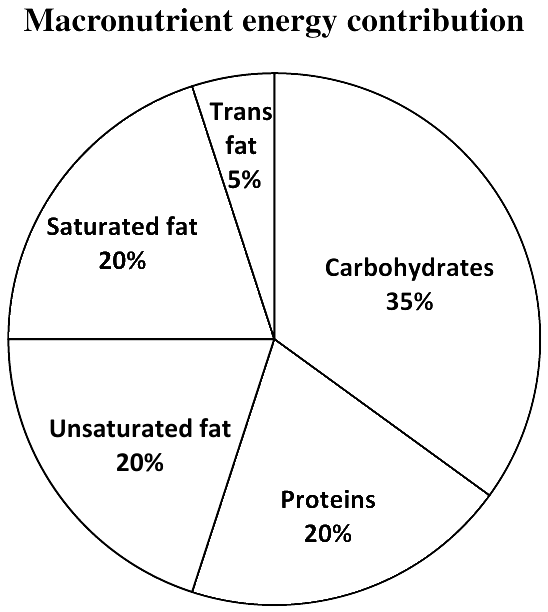
The typical energy density (kcal/g) of these macronutrients is given in the table.
| Macronutrient | Energy density (kcal/g) |
|---|---|
| Carbohydrates | 4 |
| Proteins | 4 |
| Unsaturated fat | 9 |
| Saturated fat | 9 |
| Trans fat | 9 |
The total fat (all three types), in grams, this person consumes is
Answer
(C)
Explanation
The three kinds of fat together supply \(5\% + 20\% + 20\% = 45\%\) of the energy in the diet:
\[0.45 \times 2000 = 900\ \text{kcal}.\]
All three fats give 9 kcal per gram, so the person eats \(\frac{900}{9} = 100\) g of fat.
Option A, 44.4 g, counts only one of the 20% fat types (\(400 \div 9\)). Carbohydrates and proteins, at 4 kcal/g, play no part in the fat total.
Answer: C